One of the first things people want to do after getting Vizuly up and running is to put their own data into one of the components. For this tutorial we will be using the Vizuly Bar Chart as an example.
In this tutorial we will create some raw custom data in the form of a .CSV string that we will then parse and convert into runtime objects that can be rendered by our chart. In your projects you can easily use other libraries to import other types of data. For instance d3.js has some great modules that make it easy to load json, csv, tsv, and another variety of external data sources.
Step 1:
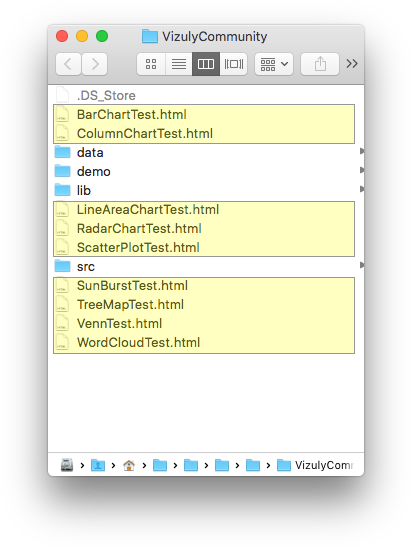
Locate the working directory your put the Vizuly Community Edition download in. It should look something like the below. Then make a copy of BarChartTest.html and name it MyBarChartTest.html. This will be the main file we will be working with.
Step 2:
Locate the data/barchart_data.js file in your Vizuly working directory and open it in the editor of your choice.
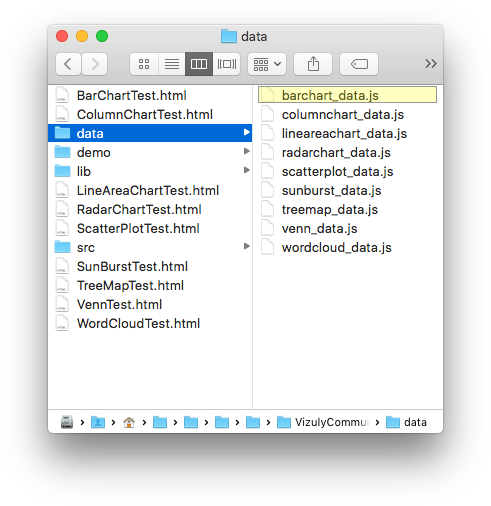
You will see code that looks like this:
var data =
[
   [
     {
       "country": "USA",
       "category": "Gold",
       "value": "1072"
     },
     {
       "country": "USSR",
       "category": "Gold",
       "value": "473"
     }...
   ],
   ...
]
This is the data structure that is being used by the Bar Chart. If you inspect this file closely you will see that the data variable
is an array that contains three other arrays, each of which has a series of objects with three properties: country, category, and value. You will notice that the first array contains all the gold categories, while the second and third contain the silver, and bronze - each of these arrays is considered a series that will be rendered accordingly by the Bar Chart.
Please note, that each Vizuly component has its own specific data structure that it expects and is documented in the respective components API doc.
Step 3:
In this step we are going to create some .csv data and parse it via d3.csvParse to create runtime javascript objects with a little bit of custom code.
Converting incoming external data into objects that can be consumed by charts is a common step in most client-side data visualization code. Client-side data visualizations usually have a certain expectation of how its incoming data will be structured and formatted. In most situations it is perfectly acceptable to write this 'data adapter' code directly in your client application versus trying to convert this data on a middle tier, or back-end. For very complex and/or large data sets where more processing power is needed you can also process this data on the back end and serve the data directly to your visualizations.
First open up your MyBarChartTest.html file that you created in Step 1.
Now copy and paste this code into the beginning of the script tag.
    var csv = 'Status,Widget_1,Widget_2,Widget_3\n' +
    'In Stock,100,85,150\n' +
    'On Order,200,39,125\n' +
    'Shipped,10,50,35';

    var rawData = d3.csvParse(csv);

    var allSeries=[];

    rawData.forEach(function (row) {
    	var series = [];
    	for (var i=1; i < 4; i++) {
          var datum = {};
          datum.status = row.Status;
          datum.part = 'Widget ' + i;
          datum.value = Number(row['Widget_'+i]);
          series.push(datum);
        }
        allSeries.push(series);
    });
This code serves two primary functions. First we use D3.js using d3.csvParse to take a CSV string and parse it into javascript objects. Second we now use a forEach loop to take this parsed data structure and convert it into a set of nested arrays that match the structure of our original test data as seen below.
[
  [
    {
      "status": "In Stock",
      "part": "Widget 1",
      "value": 100
    },
    {
      "status": "In Stock",
      "part": "Widget 2",
      "value": 85
    },
    {
      "status": "In Stock",
      "part": "Widget 3",
      "value": 150
    }
  ],
  [
    {
      "status": "On Order",
      "part": "Widget 1",
      "value": 200
    },
    {
      "status": "On Order",
      "part": "Widget 2",
      "value": 39
    },
    {
      "status": "On Order",
      "part": "Widget 3",
      "value": 125
    }
  ],
  [
    {
      "status": "Shipped",
      "part": "Widget 1",
      "value": 10
    },
    {
      "status": "Shipped",
      "part": "Widget 2",
      "value": 50
    },
    {
      "status": "Shipped",
      "part": "Widget 3",
      "value": 35
    }
  ]
]
Step 4
The final step in this process is to now pass our new data structure into our chart and specify what properties we will be using to render the x and y axis.
Please modify the code in the script tag of your MyBarChartTest.html file so it looks like the code below. In this step we are updating the neccessary properties of the Vizuly Bar Chart by modfiying viz.data viz.x, viz.y, and viz.seriesLabel functions to use the allSeries,d.value, d.part, and d.status properties respectively.
    viz
     .data(allSeries)
     .width('100%')
     .height('100%')
     .x(function (d, i)  { return d.value; })
     .y(function (d, i)  { return d.part; })
     .seriesLabel( function (d,i) { return d.status; })
     .style('show-value-labels',false)
     .updateOnResize(true)
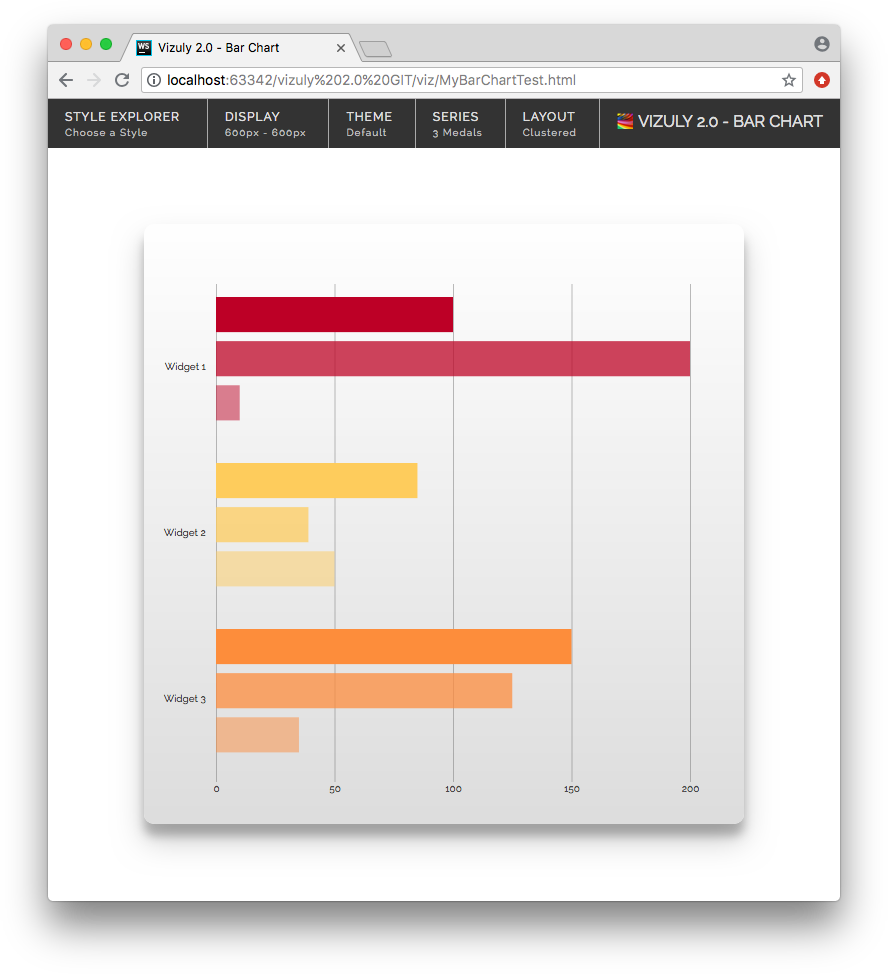
Once you have made the above changes, launch the MyBarChartTest.html file in your browser and you should see something like the below:
Conclusion
While this example uses a relatively simple data set, the process for loading custom data into any Vizuly component is the same:
- Load External Data - Either directly in JavaScript as we did here, or using any type of remote loading/fetching library, such as
d3.fetch - Modify/Adapt your external data into the prescribed format and structure expected by the Vizuly Component.
- Set the various component properties to properly read and render your adpated data structure.
Note: As we mention above, it is possible to have your external data pre-formatted so you can pass it direclty to a Vizuly component without requiring any client-side pre-processing. That is a choice you can make based on your project requirements and resources