A good starting point for integrating Vizuly into an HTML/Javascript app is to take a look at the test container files. These files have all the code needed to get Vizuly running within an HTML app, but they also include some additional code that is used to demonstrate and test the container. In this tutorial we will walk through the process of creating an HTML page from scratch and adding the required references and code to run the VizulyBarChart component.
Step 1. Create a blank HTML page.
In the editor of your choice create an html file called 'MyBarChart.html' and save it in the same directory as your other Vizuly test containers, then paste this code into it:
<!DOCTYPE html>
<html lang="en">
<head>
    <meta charset="UTF-8">
    <title>My Vizuly Bar Chart</title>
</head>
<body>

</body>
</html>
If you open this file in your browser you will see a blank screen, as we have not added any code to it yet.
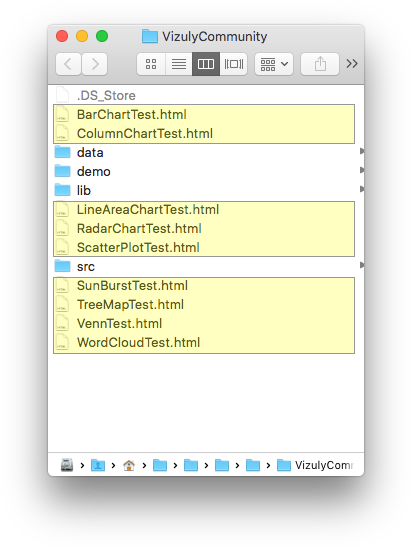
Note: It is important that you save this file in the same directory as the test containers as shown below, otherwise it won't be able to reference the CSS and Javascript files properly. The directory should look like this one below
Step 2. Add CSS and Javascript References:
Place the follwing code within the <head> tag of your MyBarChart.html file:
    <link rel="stylesheet" href="lib/styles/vizuly.css">

    <script src="lib/d3_v5.7.min.js"></script>

    <script src="lib/vizuly2_core.min.js"></script>
    <script src="src/BarChart.js"></script>
This code does several things. First it references the vizuly.css file which contains the necessary CSS for Vizuly components to render properly. Second it loads version 5.7 of d3.js, which Vizuly depends on. Then we load the vizuly2_core.min.js file which is a minified version of all the core Vizuly code. Finally we load the BarChart.js file that contains all the source code for the BarChart component, if you want to use another Vizuly component then you will want to reference that source file, like ColumnChart.js. These files are NOT minified so if you wish to modify the source code it is easy to do so and they are all relatively small files.
Note: Vizuly is designed to work with d3.js version 4.00+, as of this writing version 5.7 is the latest tested version of d3.js used to compile Vizuly. If your application relies upon a different or incompatible version of d3.js it is possible to have Vizuly reference a specific version of d3.js than what is in your app. You can set this by calling vizuly2.loadD3(myD3Module) prior to instantiating any Vizuly components (myD3Module is a variable that holds scope to the d3 module version you want to use.)
Step 3. Add a DIV container for your Chart.
Now that you have the proper references loaded, we need to create a parent DOM element to contain our VizulyBarChart. Place the following code in your <body> tag. Every Vizuly component needs a reference to a DOM element that will serve as its parent container. In most cases you will want to use a <div> element.
<body>
   <div id="myDiv" style="width:600px; height:600px; margin:0px auto;"></div>
</body>
Step 4. Add Javascript code to create your Chart.
Add the following code at the bottom of your <body> tag:
<script id="testscript">

  var viz = vizuly2.viz.BarChart("#myDiv");

  var data = [
    [{'stock': 'In Stock', 'fruit' : 'Apples', 'value': 10,},{'stock': 'In Stock', 'fruit' : 'Peaches', 'value': 15},{'stock': 'In Stock', 'fruit' : 'Pears', 'value': 20}],
    [{'stock': 'Out Of Stock', 'fruit' : 'Apples', 'value': 4,},{'stock': 'Out Of Stock', 'fruit' : 'Peaches', 'value': 8},{'stock': 'Out Of Stock', 'fruit' : 'Pears', 'value': 30}]
   ]

  viz
   .data(data)
   .width('100%')
   .height('100%')
   .x(function (d, i)  { return Number(d.value); })
   .y(function (d, i)  { return d.fruit; })
   .seriesLabel( function (d,i) { return d.stock })
   .update();

</script>
This javascript code does 3 main things. First we instantiate our viz by calling vizuly2.viz.BarChart(). This method takes either a CSS id selector OR you can pass a DOM element directly like this vizuly2.viz.BarChart(document.getElementById('myDiv'))
Once we have instantiated our component we then make some data to pass into it. In your code you will most likely be importing your data from an external source. Please see the Using your own Data tutorial for more details on loading data. In this case we create the data variable and create a two series array contaning in/out of stock fruits.
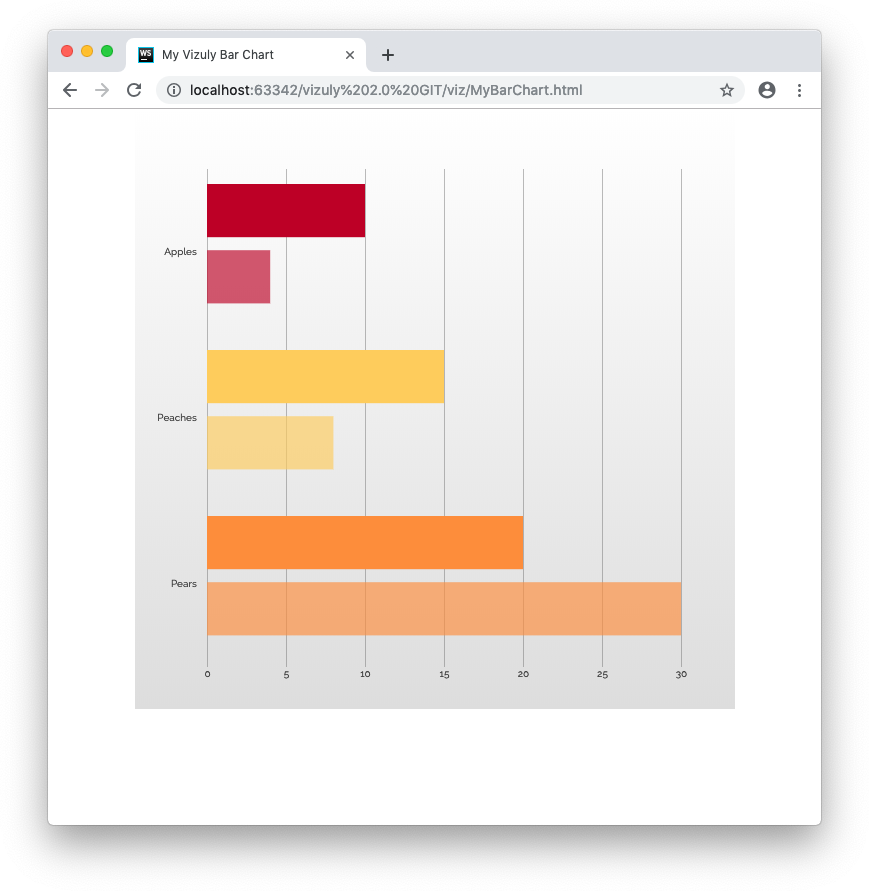
We then set our various component properties for data, width, height, x/y accessors and the series label. This is followed up witht the viz.update() call that renders our visualization to the screen.
If you now open up this html page in your browser, your screen should look something like this one below:
Thats it! You now have a running React app with examples of all the vizuly components. If you scroll down the app you will see all of the Vizuly components rendered to the screen.
And below is a copy of all the HTML/Javascript code for the file:
<!DOCTYPE html>
<html lang="en">
<head>
    <meta charset="UTF-8">
    <title>My Vizuly Bar Chart</title>

    <link rel="stylesheet" href="lib/styles/vizuly.css">

    <script src="lib/d3_v5.7.min.js"></script>

    <script src="lib/vizuly2_core.min.js"></script>
    <script src="src/BarChart.js"></script>

</head>
<body>
  <div id="myDiv" style="width:600px; height:600px; margin:0px auto;"></div>


  <script id="testscript">

	  var viz = vizuly2.viz.BarChart(document.getElementById('myDiv'));

	  var data = [
        [{'stock': 'In Stock', 'fruit' : 'Apples', 'value': 10,},{'stock': 'In Stock', 'fruit' : 'Peaches', 'value': 15},{'stock': 'In Stock', 'fruit' : 'Pears', 'value': 20}],
        [{'stock': 'Out Of Stock', 'fruit' : 'Apples', 'value': 4,},{'stock': 'Out Of Stock', 'fruit' : 'Peaches', 'value': 8},{'stock': 'Out Of Stock', 'fruit' : 'Pears', 'value': 30}]
       ]

	  viz
	   .data(data)
	   .width('100%')
	   .height('100%')
	   .x(function (d, i)  { return Number(d.value); })
	   .y(function (d, i)  { return d.fruit; })
	   .seriesLabel( function (d,i) { return d.stock })
	   .updateOnResize(true)
       .update();

  </script>

</body>
</html>
Conclusion
Using Vizuly in your HTML projects is pretty straight forward as it has very few dependencies and does not require any compiling of javascript code or other tool-chains. Because Vizuly has very few dependencies it also works well with other html/javascript frameworks like bootstrap or jQuery. If you plan on using Vizuly in a webpack based project like Angular or React, please see the following tutorials Vizuly in Angular or Vizuly in React.