In Vizuly there are two primary ways to externally modify the appearance and function of a visualization component, Properties and Styles.
The primary difference between a Property and Style is how they are used in rendering a visualization. Properties are generally used to help bind data and other properties so the component can measure and perform the layout and addition/substraction of the various DOM Elements (SVG objects) that are painted onto the users screen. Some obvious properties are things like viz.width(600), viz.height(600), or viz.data(myData).
Styles on the other hand are primarily used to modify and update various aesthetic properties of a given geometric element on the screen AFTER they have been measured, created, and positioned. This process is invisible to the end user, as it all occurs prior to the screen being refreshed. An example style is viz.style('bar-fill', 'red') which would color the inside of a given bar red.
In order for you to see any changes you may have made to a components Properties or Styles you will always want to call the viz.update() method which will trigger the components render pipeline which is summarized below.
Render Pipeline
viz.update()called.component.measure()(Determines the number, position, sizing of on screen objects based on property settings)component.update()(Inserts/Removes/Updates on screen objects according to measurements)component.applyStyles()(Applies various styles to on screen objects based on style settings)- Browser refreshed screen with updated visualization.
Properties:
Setting properties is very easy and follows the common function chain pattern that you may be familar with from libraries like D3.js or JQuery. Below is an example of setting some of the properties on a Vizuly Bar Chart:
   viz
     .data(data)
     .width('100%')
     .height('100%')
     .x(function (d, i)  { return Number(d.value); })
     .y(function (d, i)  { return d.country; })
Each Vizuly component has a specific set of properties, each of which expects a certain object type or data format. To see what properties are available for a given component and what format and data type is expected you can refer to our component API documents. For instance here are the properties and styles for the Vizuly Bar Chart
If you want to view the current value of a given property you can just call the property in question without passing in a value like this: viz.data() or viz.width(). In both cases you will be returned the current value of the respective property.
Note: Since Javascript is a loosely typed language there are no runtime checks on data types or formats when setting properties. This means that if you set a property with an invalid data type or format you will most likely get a runtime error that you would need to debug via the browser's debug console. In some cases Vizuly will perform type checks on critical properties and provide warnings via the debugger console.
Styles:
Setting styles in Vizuly is also very straightforward, but styles have some special features that properties do not. First off, all styles are treated as dynamic functors which can either be set as a static value OR a function.
Here is an example of using a static value to set the fill color of all the bars of the component to red.
viz.style('bar-fill','red')
Below is an example of using a dynamic function that sets the bars fill color based on its ordinal position along the axis
viz.style('bar-fill', function (d, i, groupIndex) {
	var axisColors = ['#bd0026', '#fecc5c', '#fd8d3c', '#f03b20', '#B02D5D', '#9B2C67', '#982B9A', '#692DA7', '#5725AA', '#4823AF', '#d7b5d8', '#dd1c77', '#5A0C7A', '#5A0C7A'];
	return axisColors[groupIndex % axisColors.length]
})
The power of these dynamic styles in creating unique and effective visualizations can not be overstated. For instance, lets say you wanted to use our Bar Chart example and highlight all the medals for the USSR by showing their value labels. You could apply the following styles do that:
viz.style('value-label-show',function (d,i) { return (d.country === 'USSR') })
   .style('value-label-font-size',12)
The result would look like this:
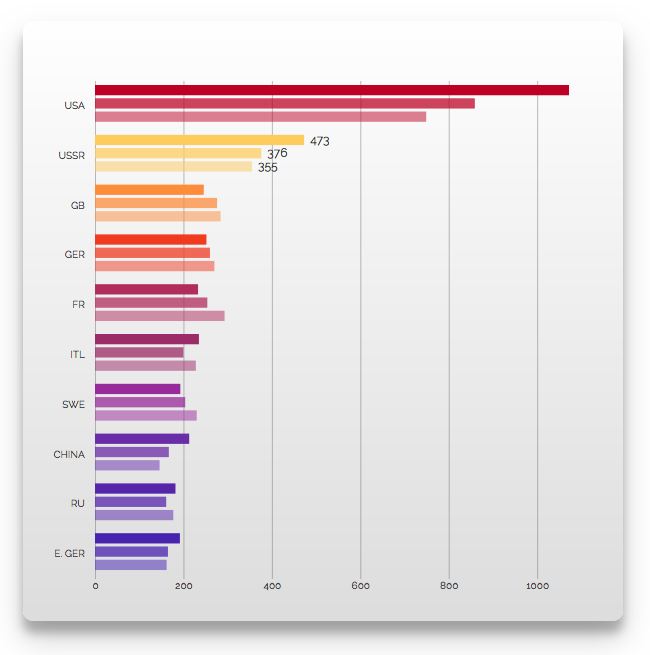
Using this technique of programtically determing style treatments at runtime based on data values or indexes is both a very flexible and powerful way to create unique visualizations based on specific data that does not require you to modify the source code of a given component.
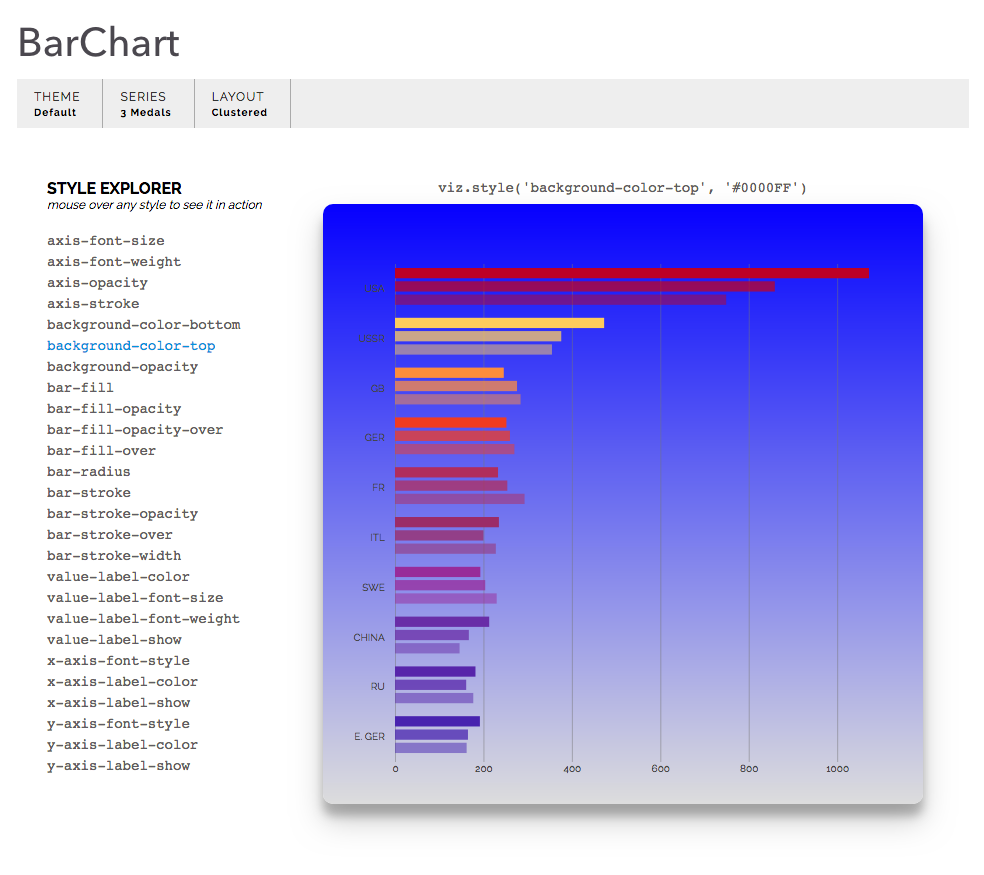
While you can find all of a components properties enumerated and described in our API docs, we have done something differently with the documentation of a components styles. To make it easier to see what specific visual changes a style affects each component comes bundled with a Style Explorer that is both part of the components test container and part of the components API documentation.
Below you can see an example of the Bar Chart Style Explorer within our API docs. By placing the mouse over the style in question on the left you can see the visual impact on the component and the code used to create that style. In this case we are looking at the background-color-top style which has been set to a static value of '#0000FF'.
When using dynamic functions to set a style value, the function will receive the following incoming arguments (based on the specific component the j argument is optional.)
| Parameter | Description |
|---|---|
d |
The datum associated with the style. |
i |
The index of the datum in its parent series. |
j |
The group index (optional) that the datum belongs to. |
this |
The DOM Element currently being styled |
If you want to view the current value of a given style you can just call the style in question without passing in a value like this: viz.style('background-color-top') or viz.style('bar-fill'). In both cases you will be returned the current value of the respective style.
While dynamic styles will not solve every unique use case for a specific set of requirements, it usually can accomodate 90% of them. If your requirements are more complex that what can be done with dynamic styles, please refer to our documentation on creating Custom Components that show you how to modify and create your own visualizations usign the Vizuly framework.